Report Page Captures
Persona Example
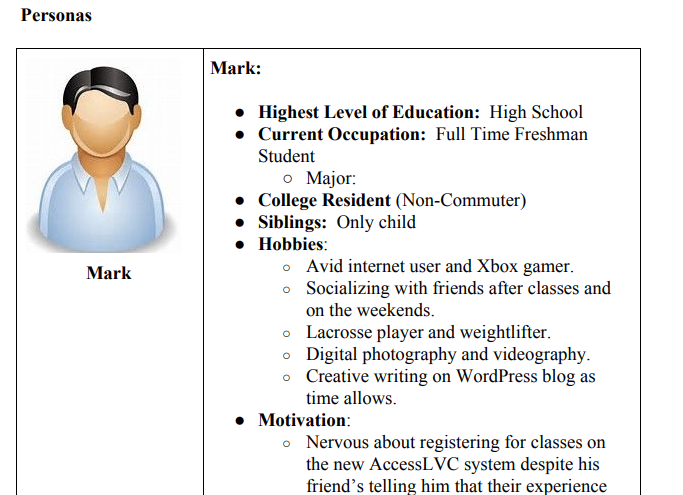
Personas were created in the early parts of our report to generate an identity for what a male/female user could look like. Report page 7 shown.
System Challenges Section
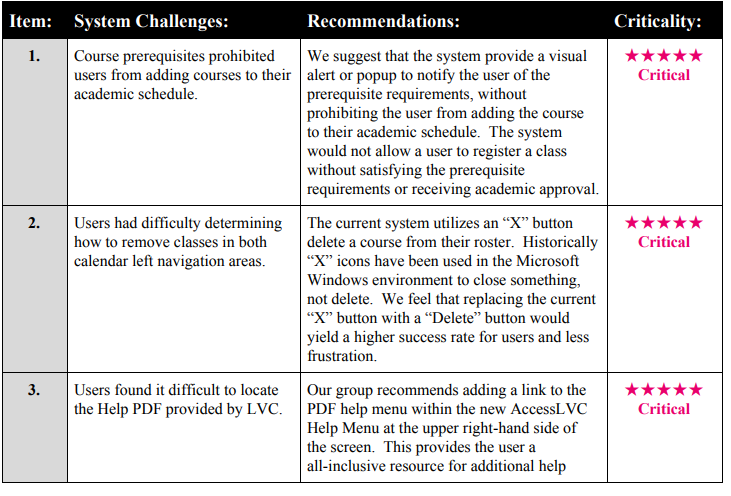
This is one type of infographic included in the report that details the difficulties users encountered, and ranks the severity of those difficulties. Report page 12.
Error Mapping Section
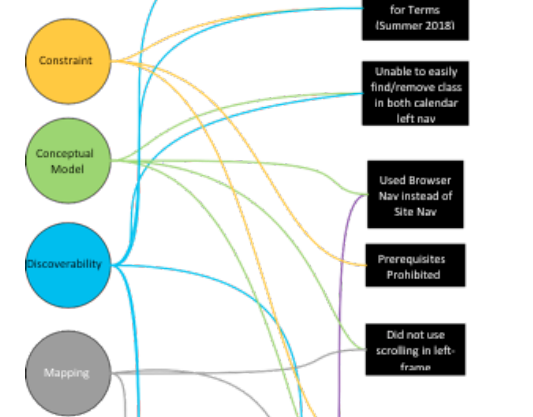
Another infographic that shows the relationship between problems and overall IA concepts that are related. Report page 11 shown.
Post Test Example
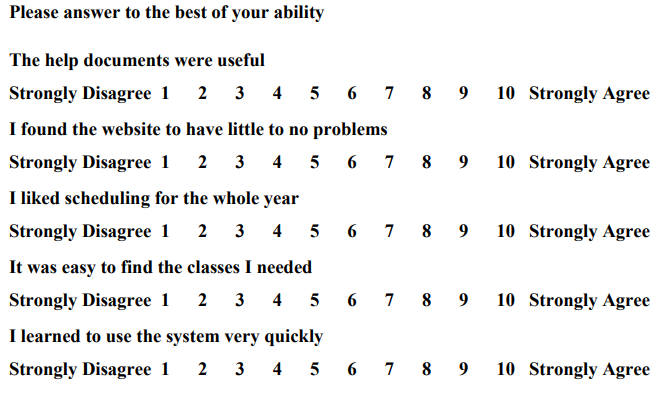
A post-test form given to users to gain more data about their experience with the tested system. Quantative data was gathered along with user preferences. Report page 29 shown.
Test Task Section
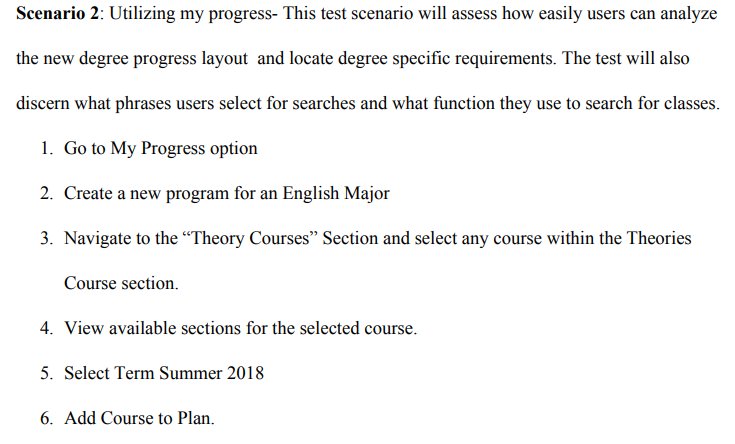
On of the scenarios users were tasked with completing. Moderator reads prompts provided to see if user can complete given task with current system and instructions. Report page 7 shown.